Visualizing Complete Buyer Journeys
Analytics that finally tell the full story. One view reveals every touchpoint, drop-off, and conversion moment.
Summary :
Challenge
Customer success managers lacked a clear way to visualize buyer journeys across sessions and touchpoints.
Target Audience
Onboarding and success managers managing customer analytics and conversions.
Impact
Delivered a dynamic visualization tool that improved decision-making speed and transparency.
The real problem
behind the work
The analytics platform tracked user behavior, but it didn’t tell a story. Data existed in pieces, spread across different tools, making it hard for teams to understand how visitors actually converted.
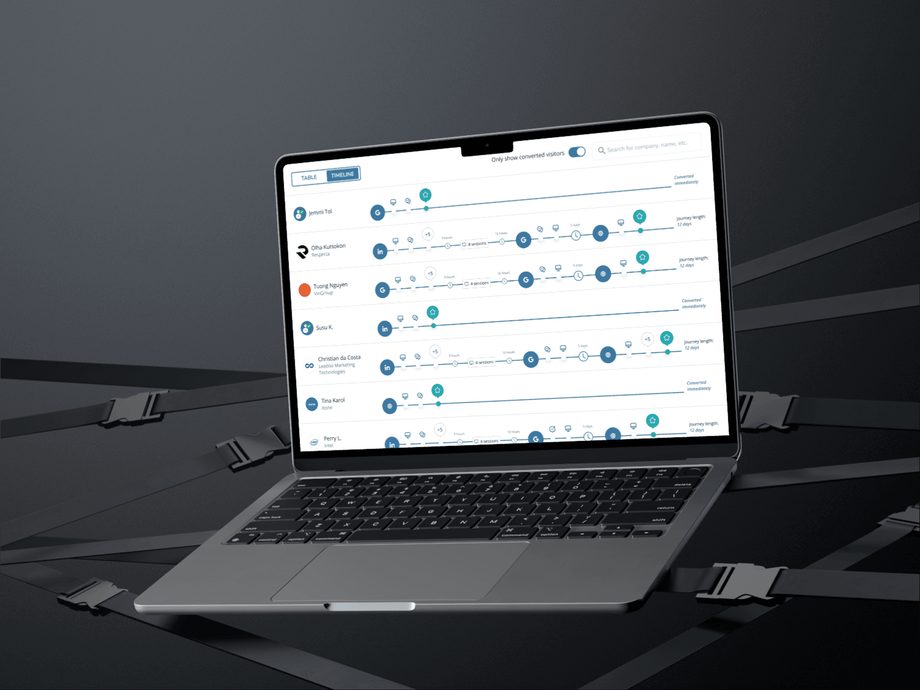
We needed to bring clarity, not more charts. Our goal was to show every user’s journey in a timeline format that could reveal intent, drop-offs, and opportunities instantly.
How We Solved It
We ran interviews and workshops with the CS team to identify key insights and pain points. Through this, we found users cared most about first and last touchpoints, session trends, and “wow moments” for client reporting.
With that knowledge, we designed an intuitive timeline view that automatically grouped sessions, events, and conversions. It turned complex behavior data into something human and easy to act on.
The Impact We Made
The new Journey Insights feature became the heart of Leadoo’s analytics suite. Teams could finally see the full story of every visitor without switching tools or losing context.
This improved reporting quality, reduced onboarding time for new clients, and gave success managers a visual, real-time understanding of how conversions actually happened.
What We Learned
Great analytics design isn’t about more data, it’s about better storytelling. Once teams could “see” the journey, they understood users faster and made smarter decisions.
The biggest win wasn’t the feature itself, but the clarity it brought to both the product team and the people using it every day.